
This book contains exercises for a physical geology lab class. It is under development, with a full 1st edition release planned for Fall 2024.
The goals of this chapter are:
- Understand
- Interpret
- Evaluate
Exercise 15.1 – How Plate Tectonics Affects Climate Change
Did you know that Earth hasn’t always had glaciated polar regions? Earth goes through periods of time when glaciers do and do not exist as its climate changes naturally. Our current phase of glaciation began about 34 mya, and before that, you have to go back to 250 mya to see the last time ice was present on the planet. On long timescales like millions of years, plate tectonics and the position of the continents drastically affect the climate on Earth.
Figure 15.1 is a map that shows glacial deposits and geomorphological features that have been identified in the red-shaded regions. These features are about 300 mya. The black arrows show a general paleo-ice-flow direction based on field data. Though it is believed ice flowed over Antarctica during this time, paleo-ice flow cannot be determined because of the overriding ice present on the continent today. Answer the questions below based on the map and your knowledge of the climate on Earth.

- Are any of these shaded regions known for supporting large, continental glaciers today? Why or why not?
- What do each of the shaded regions have in common geographically?
- Where are ice sheets on Earth located today? Why are they able to last there?
- Do glaciers typically flow from sea to land? How do you explain why glaciers appear to have done this?
- Now that you have thought critically about the map, give a brief explanation for why we see glacial signatures in these regions today.
- Where do you think the paleo-south pole may have been relative to these continents at the time of glaciation? Why? Mark this position on the map with a star.
- Draw a line across the present-day continents showing an estimated position of the equator during this glaciation.
- Do you think these areas may become glaciated again?
- Critical Thinking: How do you think Earth differs when there isn’t a land mass at the poles?
Exercise 15.2 – Sea Ice
Sea ice is different from glaciers. Sea ice is a thin layer of frozen ocean, and glaciers are ice masses on land. The annual formation of sea ice at each pole is a very important event for a number of environmental processes. Sea ice development supports krill populations (the base of the marine food chain), provides passages for certain animals to migrate, increases albedo (the amount of the sun’s energy that is reflected back into space), and helps to drive global ocean circulations. The National Snow and Ice Data Center has tracked the area of sea ice in the Arctic and Antarctic since 1979. Use this data to answer the following questions.
- Hide all data and select the plot for 2022. What can you say about the seasonality of sea ice in the Arctic?
- What is the approximate difference in sea ice extent (in millions of km2) between the peak and trough of 2022?
- Still looking only at the 2022 plot, what can you say about long-term trends in sea ice formation over time?
- Now turn on the 2012 plot as well. With these two data sets, what can you say about trends in sea ice formation over the decade?
- What do you think may have been some possible causes of the anomalously low sea ice in 2012?
- As the site says, 2012 had record low sea ice in the Arctic. Do you think using 2012 data to compare to other years might be biasing our data? Why or why not?
- Turn off the 2012 and 2022 plots. Now select the four decadal averages. What can you say about sea ice trends in the Arctic over the last half-century?
- Critical Thinking: How do you think this may affect the global economy? Which countries do you think may be most closely watching sea ice levels in the Arctic?
Exercise 15.3 – Sea-Level Rise and Coastal Erosion
In 1999, the Cape Hatteras Lighthouse in North Carolina was moved from the original position it was built in 1870 (Figure 15.2). Upon its completion, the lighthouse was an estimated 450 meters away from the coastline. Even in 1870, strong storm surges brought seawater to the base of the lighthouse. Following over a century of sea level rise that resulted in even more intense surges, it was determined that to preserve the lighthouse, it should be moved further inland where storms would have less effect on the foundation of the structure. Answer the questions below about the Cape Hatteras Lighthouse and its relationship to sea-level rise.
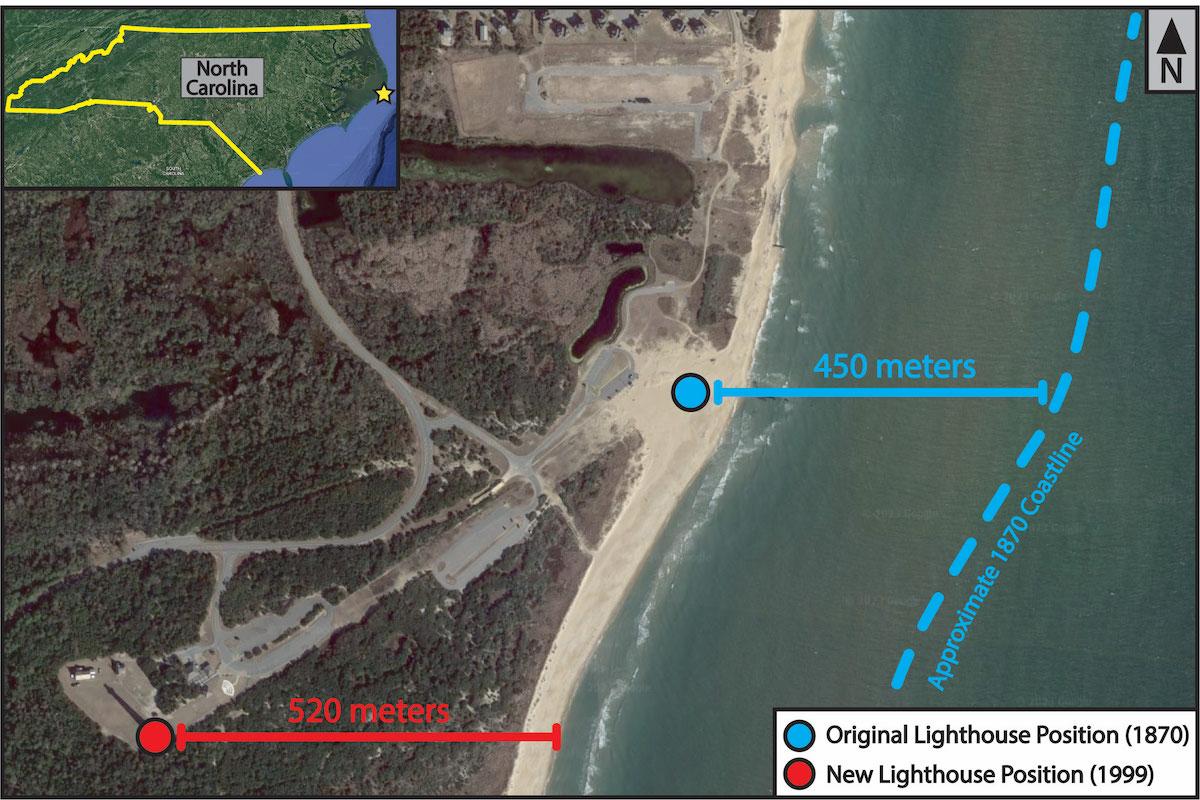
- According to the National Oceanic and Atmospheric Association (NOAA), the pace of sea level rise through most of the 20th century was 1.4 mm/yr. Using this pace, how much has sea level risen since the lighthouse’s construction in 1870? ____________________
- If the lighthouse was approximately 450 meters from the coastline when it was built in 1870, and its old position is now ~50 meters from the coast. At what rate (in m/yr) did the shoreline advance onto Hatteras Island? ____________________
- Are you surprised by the distance the shoreline encroached compared to the amount of sea level rise? Explain.
- What do your answers say about the slope of the shorefront?
- Do you think this shoreline slope is representative of shorelines around the world? Why or why not?
- Sea-level rise estimates from 2006-2015 put the current pace at 3.6 mm/yr. If the lighthouse was moved approximately 520 meters inland, how long would it take for the sea to reach the new position of the lighthouse? Assume a constant rate of rise and a similar inland slope.
- Why do you think the rate of sea level rise has increased so dramatically?
- Critical Thinking: Predictions of future sea-level rise over the coming centuries are highly variable but are expected to increase steadily. What do you think this means for the future of coastal communities and ecosystems?
